
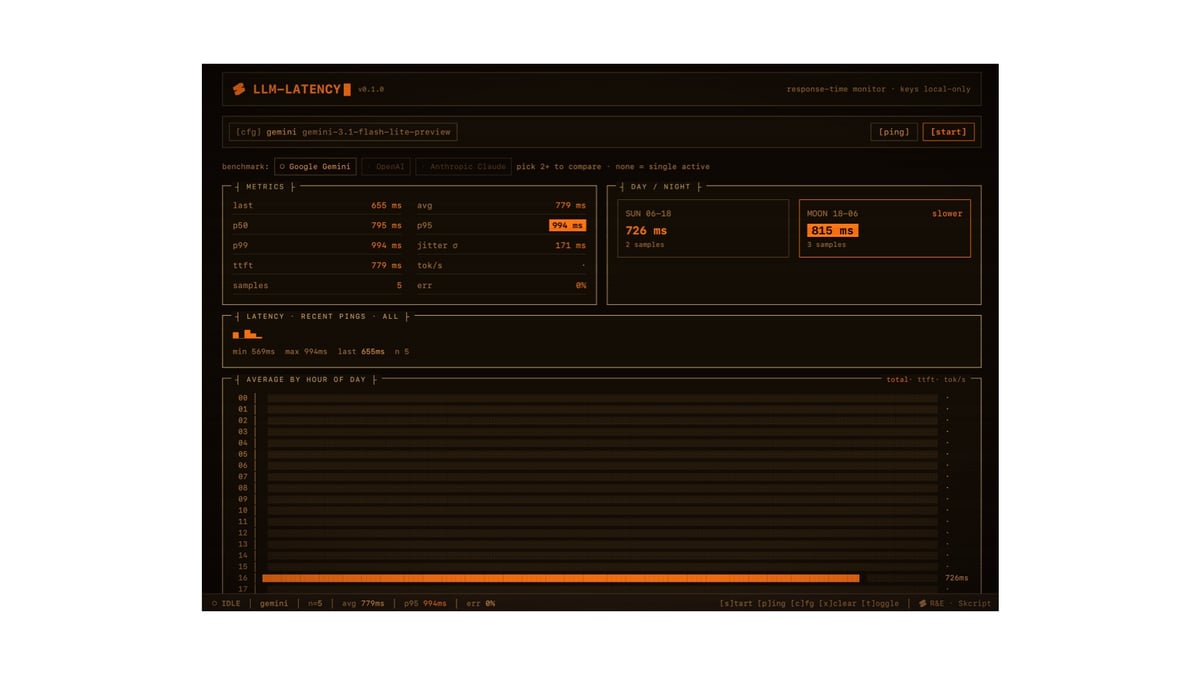
While building SupportWire, we ran into something that doesn't show up on any model's pricing page. The same prompt, sent to the same model, doesn't always come back at the same speed.
Send "summarize this conversation" to a model at 9am and it might respond in 700ms. Send the exact same prompt at 9pm and it can take twice as long. The model didn't change. The prompt didn't change. The time of day did.
For most apps that variance doesn't matter. For live chat, it's the whole experience.
Why a second matters
SupportWire has a target we care about a lot: the first response in a live chat should land in under one second. That's roughly the line between a conversation that feels responsive and one where the customer starts wondering if anything is happening.
A one second budget doesn't leave much room. If a provider is fast on average but spikes to three seconds during busy hours, then "fast on average" is the wrong thing to look at. We needed to know how a model behaves at the times our customers are actually online, not how it does in a one-off test.
So we stopped guessing and started measuring.
The tool
It started as a script. We pointed it at a provider, sent the same prompt on a timer, and logged how long each response took. Then we wanted to bucket it by hour. Then percentiles. Then a second provider to compare against. At some point it was useful enough that we cleaned it up and put it out in public.
It runs entirely in your browser. No backend, no account, no sign-up. Your API keys are stored only in your browser's local storage and sent straight to the provider. Nothing touches our servers.
What it measures
Every ping records three things from a real streaming response:
- Total latency: request sent to the full response received.
- Time to first token (TTFT): how long until the first token shows up. For live chat this is the number that matters most.
- Tokens per second: generation speed once the stream starts.

From those samples it builds the rest of the picture:
- Percentiles (p50, p95, p99), not just the average. The average hides the bad cases. p95 is closer to what a customer feels on a slow request.
- Jitter, so you can see how consistent the responses are. Steady but slightly slower can beat fast but unpredictable.
- Average by hour of day, which was the reason we built this in the first place. You can see exactly when a provider slows down.
- A day vs night split, for a quick read on whether off-peak is actually faster.
Benchmark a few models at once
Pick two or more providers and it pings them at the same time, with the same prompt, on every interval. You get a side by side comparison of latency, percentiles, and throughput. That makes it easier to answer "which model is fastest for our traffic" with numbers rather than a hunch.
Gemini, OpenAI, and Anthropic are built in. You can add any OpenAI-compatible endpoint from the settings (Groq, OpenRouter, Together, Mistral, DeepSeek, Ollama, and others). All it needs is a base URL, a model name, and a key.

How to use it
- Open llm-latency-benchmark.skcript.com.
- Press
[cfg], pick a provider tab, paste your API key, and check it. - Add more providers if you want a head-to-head, then tick them on the benchmark strip.
- Press
[start]. It pings on your chosen interval and fills the charts. - Leave the tab open through the day to get the full hour-by-hour view. Export to JSON or CSV anytime.
There are keyboard shortcuts for the common actions: [s]tart, [p]ing, [c]onfig, [x]clear, [t]oggle.
One thing to know: measurement only runs while the tab is open, so the longer you leave it running, the more complete your day-and-night data gets.
It's open source
It's built with SvelteKit and runs on Cloudflare Pages. The code is on GitHub at skcript/llm-latency-checker, MIT licensed. The codebase is small. If you want to add a provider or a metric, send a pull request.
This is one of the small things that came out of the R&E Group at Skcript while building SupportWire. Latency is half the story. The other half is giving the agent real hands — how we built Data Connectors for Kal without handing it the keys. We needed both, so we built both.